
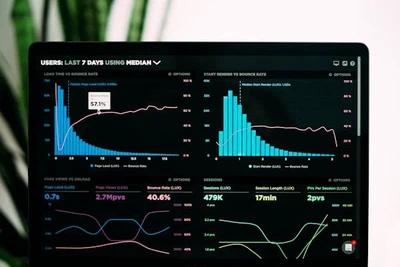
📈 Communicate your results effectively with the best data visualizations
 Image credit: Unsplash
Hugo Blox is designed to give technical content creators a seamless experience. You can focus on the content and Hugo Blox handles the rest.
Use popular tools such as Plotly, Mermaid, and data frames.
Embed Rich Content
HuggingFace Model
HuggingFace Dataset
a.k.a. Awesome ChatGPT Prompts This is a Dataset Repository mirror of prompts.chat — a social platform for AI prompts. 📢 Notice This Hugging Face dataset is a mirror. For the …
GitHub Repository
🧱 Describe your site, AI builds it, you own it as Markdown. Snap together Tailwind blocks like Lego — landing pages, blogs, portfolios, docs & more. No AI slop. Free to deploy anywhere 👇
Custom embed with manual data
A great resource for learning
Custom Images
Embed beautiful images from any source with Hugo image processing (Unsplash, custom URLs, etc.):

Beautiful data visualization workspace
You can also add images to any platform embed:
Charts
Hugo Blox supports the popular Plotly format for interactive data visualizations. With Plotly, you can design almost any kind of visualization you can imagine!
Save your Plotly JSON in your page folder, for example line-chart.json, and then add the {{< chart data="line-chart" >}} shortcode where you would like the chart to appear.
Demo:
You might also find the Plotly JSON Editor useful.
Diagrams
Hugo Blox supports the Mermaid Markdown extension for diagrams.
An example flowchart:
```mermaid
graph TD
A[Hard] -->|Text| B(Round)
B --> C{Decision}
C -->|One| D[Result 1]
C -->|Two| E[Result 2]
```
renders as
An example sequence diagram:
```mermaid
sequenceDiagram
Alice->>John: Hello John, how are you?
loop Healthcheck
    John->>John: Fight against hypochondria
end
Note right of John: Rational thoughts!
John-->>Alice: Great!
John->>Bob: How about you?
Bob-->>John: Jolly good!
```
renders as
An example class diagram:
```mermaid
classDiagram
Class01 <|-- AveryLongClass : Cool
Class03 *-- Class04
Class05 o-- Class06
Class07 .. Class08
Class09 --> C2 : Where am i?
Class09 --* C3
Class09 --|> Class07
Class07 : equals()
Class07 : Object[] elementData
Class01 : size()
Class01 : int chimp
Class01 : int gorilla
Class08 <--> C2: Cool label
```
renders as
An example state diagram:
```mermaid
stateDiagram
[*] --> Still
Still --> [*]
Still --> Moving
Moving --> Still
Moving --> Crash
Crash --> [*]
```
renders as
Data Frames
Save your spreadsheet as a CSV file in your page’s folder and then render it by adding the Table shortcode to your page:
{{< table path="results.csv" header="true" caption="Table 1: My results" >}}
renders as
| customer_id | score |
|---|---|
| 1 | 0 |
| 2 | 0.5 |
| 3 | 1 |
Interactive Buttons
Add engaging call-to-action buttons to your data visualization posts:
Basic Buttons
{{< button url="/" >}}Contact Us{{< /button >}}

{{< button url="https://plotly.com/python/" new_tab="true" style="secondary" >}}Learn Plotly{{< /button >}}
Styled Buttons for Data Actions
{{< button url="#" style="primary" size="lg" align="center" icon="chart-bar" >}}View Dashboard{{< /button >}}

{{< button url="/data/results.csv" style="outline" icon="document-arrow-down" >}}Download Data{{< /button >}}

{{< button url="https://github.com/HugoBlox" new_tab="true" style="ghost" icon="arrow-top-right-on-square" icon_position="right" >}}View Source Code{{< /button >}}
Multiple Aligned Buttons
{{< button url="https://jupyter.org/" new_tab="true" style="secondary" rounded="full" align="center" >}}Try Jupyter{{< /button >}}

{{< button url="https://colab.research.google.com/" new_tab="true" style="primary" rounded="full" align="center" icon="rocket-launch" >}}Open in Colab{{< /button >}}
Did you find this page helpful? Consider sharing it 🙌

I am Chris Yee Wong, an assistant professor in the Department of Mechanical, Industrial and Aerospace Engineering (MIAE) and the director of the Living with Assistive and Interactive Robots (LAIR) Lab at Concordia University in Montreal, Canada.
The overall goal of my research is to develop robotic assistants for safe, comfortable, and intuitive autonomous physical and social human-robot interaction (psHRI) in the areas of home care, retail, manufacturing, or healthcare. My current research arc involves different aspects of psHRI with humanoid, mobile, and manipulator robots, particularly by examining a) how a robot can infer intention and react appropriately depending on the context by using a multimodal analysis of human posture, gesture, touch, emotional state, physiological signals, environmental signals, etc; b) how robots can be placed in the retail space to enhance and assist the shopping experience of those who might have visual or mobility impairments; and c) how virtrual reality can be used in psHRI.
I am also developing the foundations of Sensor Observability Analysis, a novel way of performing generalized kinematic analysis of distributed axial sensors on articulated robots. My past research involved automation of single cell micromanipulation, quadruped robot control, and hexapod robot leg design.
I am also passionate about teaching using evidence-based techniques, the scholarship of teaching and learning, mentoring, and helping people become better versions of themselves.
On my spare time, I’m a hobbyist maker with my own Etsy store (with corporate clients) and I’m involved in coaching elite youth and university-level dragon boat in the Montreal area. Although my blog Ramblings of a PhD is only occasionally updated, it has recorded some of my thoughts from having started a career in academia.
Feel free to contact me by email: christopheryee[dot]wong[at]concordia[dot]ca
(Note that this website is still a work in progress. Please use the links to my ResearchGate and LinkedIn profiles for a more detailed portfolio.)